Insights
How high must unemployment rise to tame inflation?
REAL ECONOMY BLOG | August 29, 2022
Authored by RSM US LLP
Restoring price stability is now the paramount policy goal at the Federal Reserve. Chairman Jerome Powell went out of his way on Friday to point out the lessons of the high inflation in the 1970s and 1980s, and the sacrifice it took to wring it out of the economy after years of delays
“Our aim is to avoid that outcome by acting with resolve now,” Powell said in his speech in Jackson Hole, Wyo.
Indeed, that objective will shape inflation, employment and growth over the next few years in a manner that will most likely result in slower growth and higher unemployment.
We revisit the Phillips curve—which shows the relationship between inflation and the unemployment rate.
But how high must unemployment rise to push inflation back toward the Federal Reserve’s 2% target?
To find an answer, we revisit the Phillips curve—which shows the relationship between inflation and the unemployment rate—to estimate the job losses that would be required to meet such a difficult task.
We then introduce a new variable to the curve—the RSM US Supply Chain Index—that accounts for the supply chain distortions during the pandemic and improves the performance of the Phillips curve model.
To reduce inflation to acceptable levels—using the personal consumption expenditures index as our preferred metric—it will be necessary to destroy between 1.7 million and 5.3 million jobs, in our estimation. That decline would translate to an unemployment rate that rises to a minimum of 4.6% ,or possibly as high as 6.7%.
The policy implications are stark.
First, it will be difficult to get back to a 2% inflation target in the near term without triggering a recession that results in somewhere between 5 million and 6 million job losses.
Second, the Fed could choose to engage in what could kindly be called opportunistic reflation and lift its inflation target to 3%, which would require an increase in unemployment to 4.6% and result in a loss of roughly 1.7 million jobs.
That is about as close as one may get to what can charitably be called a soft landing. While a soft landing would be an optimal outcome, resetting the inflation target from the flexible target of 2% it announced two years ago would hurt the Fed’s credibility.
But the Fed may have little choice. Given the difficulty of the policy challenge, the economy’s move from insufficient aggregate demand to insufficient aggregate supply, and the proliferation of risks to the economy, we would not be surprised if the Fed pushed inflation back down to 3% and then revised its target rate.
The Phillips curve trade-off
Named after the economist A.W. Phillips, the Phillips curve has become one of the most important cornerstones of modern macroeconomics. In his seminal paper published in 1958, Phillips pointed out the inverse relationship between unemployment and wage growth.
Since then, the curve has been extended and then augmented to show the short-term relationship between unemployment and inflation with major contributions from two Nobel laureates in economics, Edmund Phelps and Milton Friedman, in the 1960s.
The intuition behind the trade-off between unemployment and inflation is that when unemployment is low, wage income is higher, which fuels more spending demand in the short run.
Given the stickiness of supply in the short run, an increase in demand will push prices higher, causing inflation to rise. The opposite is also true: High unemployment leads to lower inflation.
But in recent years, and especially during the pandemic, the Phillips curve relationship has become less clear, adding to the reasons why both market participants and the Fed’s inflation forecasts were so wrong.
In hindsight, the primary explanation for the Fed’s failure to stay in front of the curve regarding inflation is the unique pandemic-related supply-chain disruptions, which have been anything but transitory.
Given that explanation, we revisit the Phillips curve to identify the level of unemployment that would be needed to bring inflation back down to the long-term target, but with an important twist: adding a proxy variable for supply-chain deficiencies using data from our proprietary RSM US Supply Chain Index.
Our supply-augmented Phillips curve includes five variables:
- Inflation expectations measured by the Fed’s Index of Common Inflation Expectations.
- The unemployment rate.
- The Congressional Budget Office’s natural rate of unemployment estimates.
- The RSM US Supply Chain Index.
- The inflation rate base on the personal consumption expenditures price index.
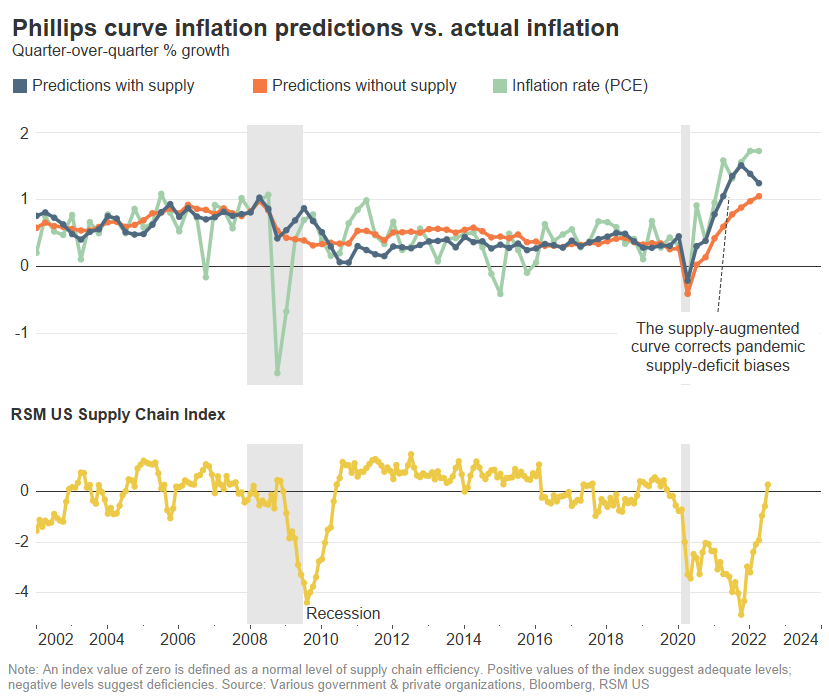
The inflation prediction results from both Phillips curve versions, or those with and without the supply chain index, are shown in the figure above.
Without controlling for supply-chain deficits during the pandemic, the Phillips curve shows significant downside biases, failing to predict how elevated inflation would become. In contrast, by including a proxy for the supply chain, the Phillips curve predictions track actual inflation levels significantly better.
Similarly, from 2012 to 2016, when there was a supply surplus, the supply-augmented Phillips curve shows a much better fit to the actual data, correcting the upside biases.
With the supply chain index added, the predicting performance of the Phillips curve in the studied period improves by 73% in terms of mean-squared error benchmarks.
Different scenarios for unemployment rates
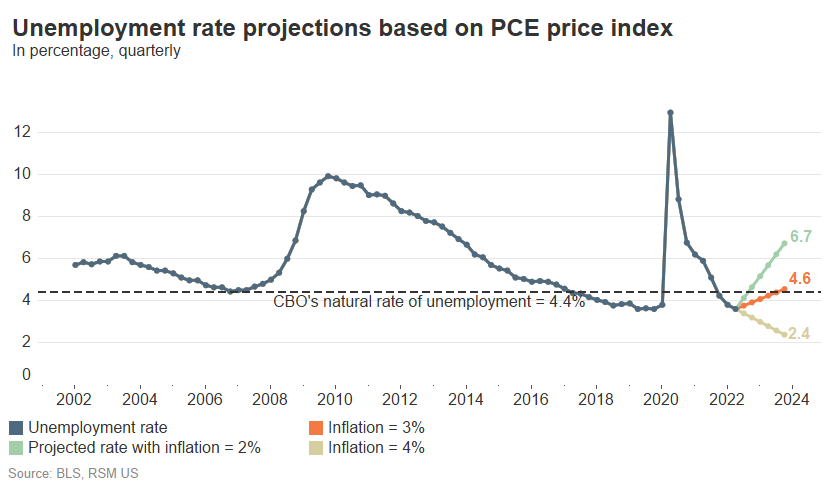
We project the new version of the Phillips curve to identify different levels of unemployment rates that would be required for the Fed to reestablish price stability. To do this, we make three key assumptions.
First, we assume the natural rate of unemployment will stay at 4.4%, in line with the CBO’s estimate for the next two years.
Second, we assume that the supply chain index will go back to its pre-pandemic average level of 0.5. This is a reasonable assumption because the July reading for the index was 0.29—above neutral for the first time since the pandemic hit.
Finally, we assume that inflation expectations will be at 2.15%, slightly lower than the most recent reading, which was at 2.19% for the second quarter of this year, and there are signs that inflation expectations are coming down.
The Fed’s inflation expectation index is based not only on professional forecasts but also on consumer surveys, which are heavily correlated with energy and gasoline prices.
Even though the Fed’s long-term target rate remains at 2%, we believe inflation will remain a lot stickier because of demographic and globalization disruptions that have transformed the macroeconomic environment from one of insufficient aggregate demand to insufficient aggregate supply. Our base case points to a 3% inflation target toward the end of next year.
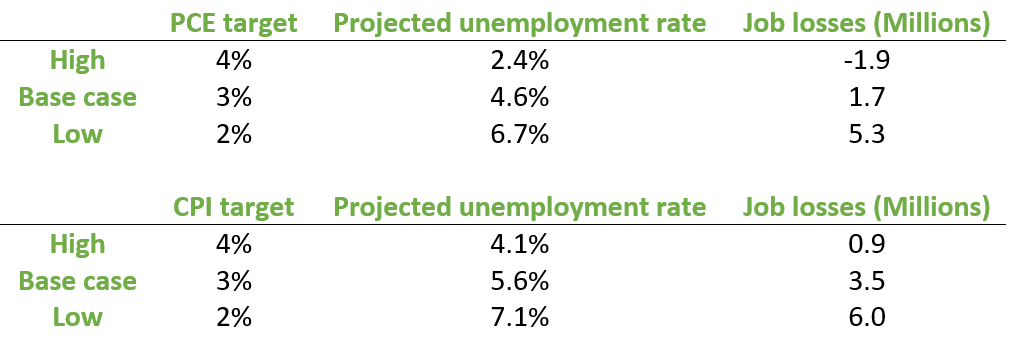
To reach the 3% base case in terms of PCE, the economy would have to shed 1.7 million jobs to get to a 4.6% unemployment rate.
This unemployment rate would be close the natural rate of unemployment forecasted by the Congressional Budget Office at 4.4%, another reason why we think this base case is much more manageable for the Fed without pushing the economy into a severe recession.
To reach the Fed’s long-term target, the cost would be much higher: 5.3 million jobs and a 6.7% unemployment rate.
We do the same exercise but with the consumer price index as a proxy for inflation. The levels of unemployment rate needed to reach the same levels of inflation are much higher because CPI inflation often runs higher than PCE inflation.
The Fed’s job to keep inflation expectations anchored is one of its top priorities. A small incremental increase in inflation expectations could have a major impact on number of jobs needed to sacrifice to get inflation back down to the target level.
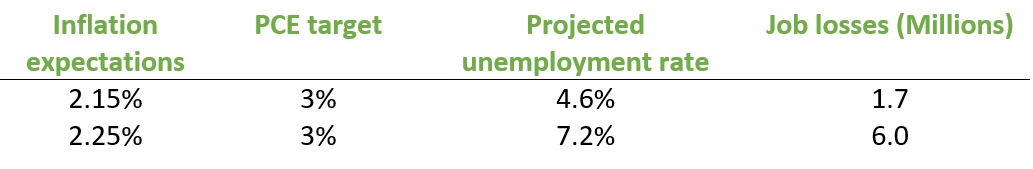
Using the supply-augmented Phillips curve, we estimate the marginal impact of inflation expectations on the unemployment rate shown above.
If inflation expectations increase by 0.1 percentage point from 2.15% in the base case above, to reach the same 3% PCE inflation target rate, the economy would have to sacrifice 6.0 million jobs at a 7.2% unemployment rate.
This underscores why we believe the Fed should continue to increase its policy rate to 4% at the end of this year to reduce inflation at a much faster rate than the what the market is pricing in.
Policy choices and trade-offs
We are in the midst of a serious cost-of-living crisis that cannot be ignored. The Fed needs to do all that it can to stabilize prices that most affect working families: food, fuel and housing. This requires policies that cool overall aggregate demand and cause unemployment to increase.
Despite the economic pain that will be required to restore price stability, it is ultimately in the interest of the real economy that it be done and done quickly.
In 1980 and 1981, Federal Reserve Chairman Paul Volcker arguably did the right thing by hiking the overnight rate to 18% to 20% to restore price stability over the long term.
While the current bout of inflation in the United States will not require that type of root canal economics, it will be necessary over the coming year or two to drive the unemployment rate higher.
Let's Talk!
Call us at +1 213.873.1700, email us at solutions@vasquezcpa.com or fill out the form below and we'll contact you to discuss your specific situation.
This article was written by Joseph Brusuelas, Tuan Nguyen and originally appeared on 2022-08-29.
2022 RSM US LLP. All rights reserved.
https://realeconomy.rsmus.com/how-high-must-unemployment-rise-to-tame-inflation/
RSM US Alliance provides its members with access to resources of RSM US LLP. RSM US Alliance member firms are separate and independent businesses and legal entities that are responsible for their own acts and omissions, and each is separate and independent from RSM US LLP. RSM US LLP is the U.S. member firm of RSM International, a global network of independent audit, tax, and consulting firms. Members of RSM US Alliance have access to RSM International resources through RSM US LLP but are not member firms of RSM International. Visit rsmus.com/about us for more information regarding RSM US LLP and RSM International. The RSM logo is used under license by RSM US LLP. RSM US Alliance products and services are proprietary to RSM US LLP.
Vasquez & Company LLP is a proud member of the RSM US Alliance, a premier affiliation of independent accounting and consulting firms in the United States. RSM US Alliance provides our firm with access to resources of RSM US LLP, the leading provider of audit, tax and consulting services focused on the middle market. RSM US LLP is a licensed CPA firm and the U.S. member of RSM International, a global network of independent audit, tax and consulting firms with more than 43,000 people in over 120 countries.
Our membership in RSM US Alliance has elevated our capabilities in the marketplace, helping to differentiate our firm from the competition while allowing us to maintain our independence and entrepreneurial culture. We have access to a valuable peer network of like-sized firms as well as a broad range of tools, expertise and technical resources.
For more information on how Vasquez & Company LLP can assist you, please call +1 213.873.1700.
Subscribe to receive important updates from our Insights and Resources.